Wikipedia says that a diagram is a symbolic representation of information using visualization techniques. I would add that mind maps and other diagrams are the most powerful yet still massively underused tools to transform real-world complexity into actionable blueprints.
You don´t have to be a designer to work professionally with mind maps. I usually draw sketches on paper or in Powepoint file, and the drawings are then made by graphic designers. For example, I´ve written here how we created the cover visual of Stories For Impact web page. The collage below demonstrates the diversity of diagram designs in various handbooks and reports that I´ve been involved with.
Any mind map or other diagram can have at least two main uses:
- a straightforward road map to plan getting from A to B; or
- a Medieval-style atlas that provides some hypothesis what the topography of the issue might look like based on available evidence, and directs attention to blank spots that need to be explored to grasp the full picture better.
Sometimes people say that they are too busy to draw mind maps.
I think that failing to visualize any complex topic as a diagram causes (among other unintended consequences):
- wasting much time while processing available information without any clear structure;
- overlooking important pieces of information and mental blind spots;
- miscommunication inside the team because – without the shared map – each team member will create a different structure in their own brain.
Conversely, allocating at least some time for mind mapping (individually and together with the team):
- helps to create a well-arranged structure that enables processing available information effectively;
- facilitates spotting important pieces of information to be included and mental blind spots to be paid attention to;
- brings team members literally to the same page (of a mind map), ideally creating a healthy debate whether the current diagram represents the complexity in the most useful way or not.
Below, I will demonstrate some examples of diagrams from the handbooks and reports that I have (co-)authored. They are in different languages, yet the visual language will be comprehensible nevertheless.
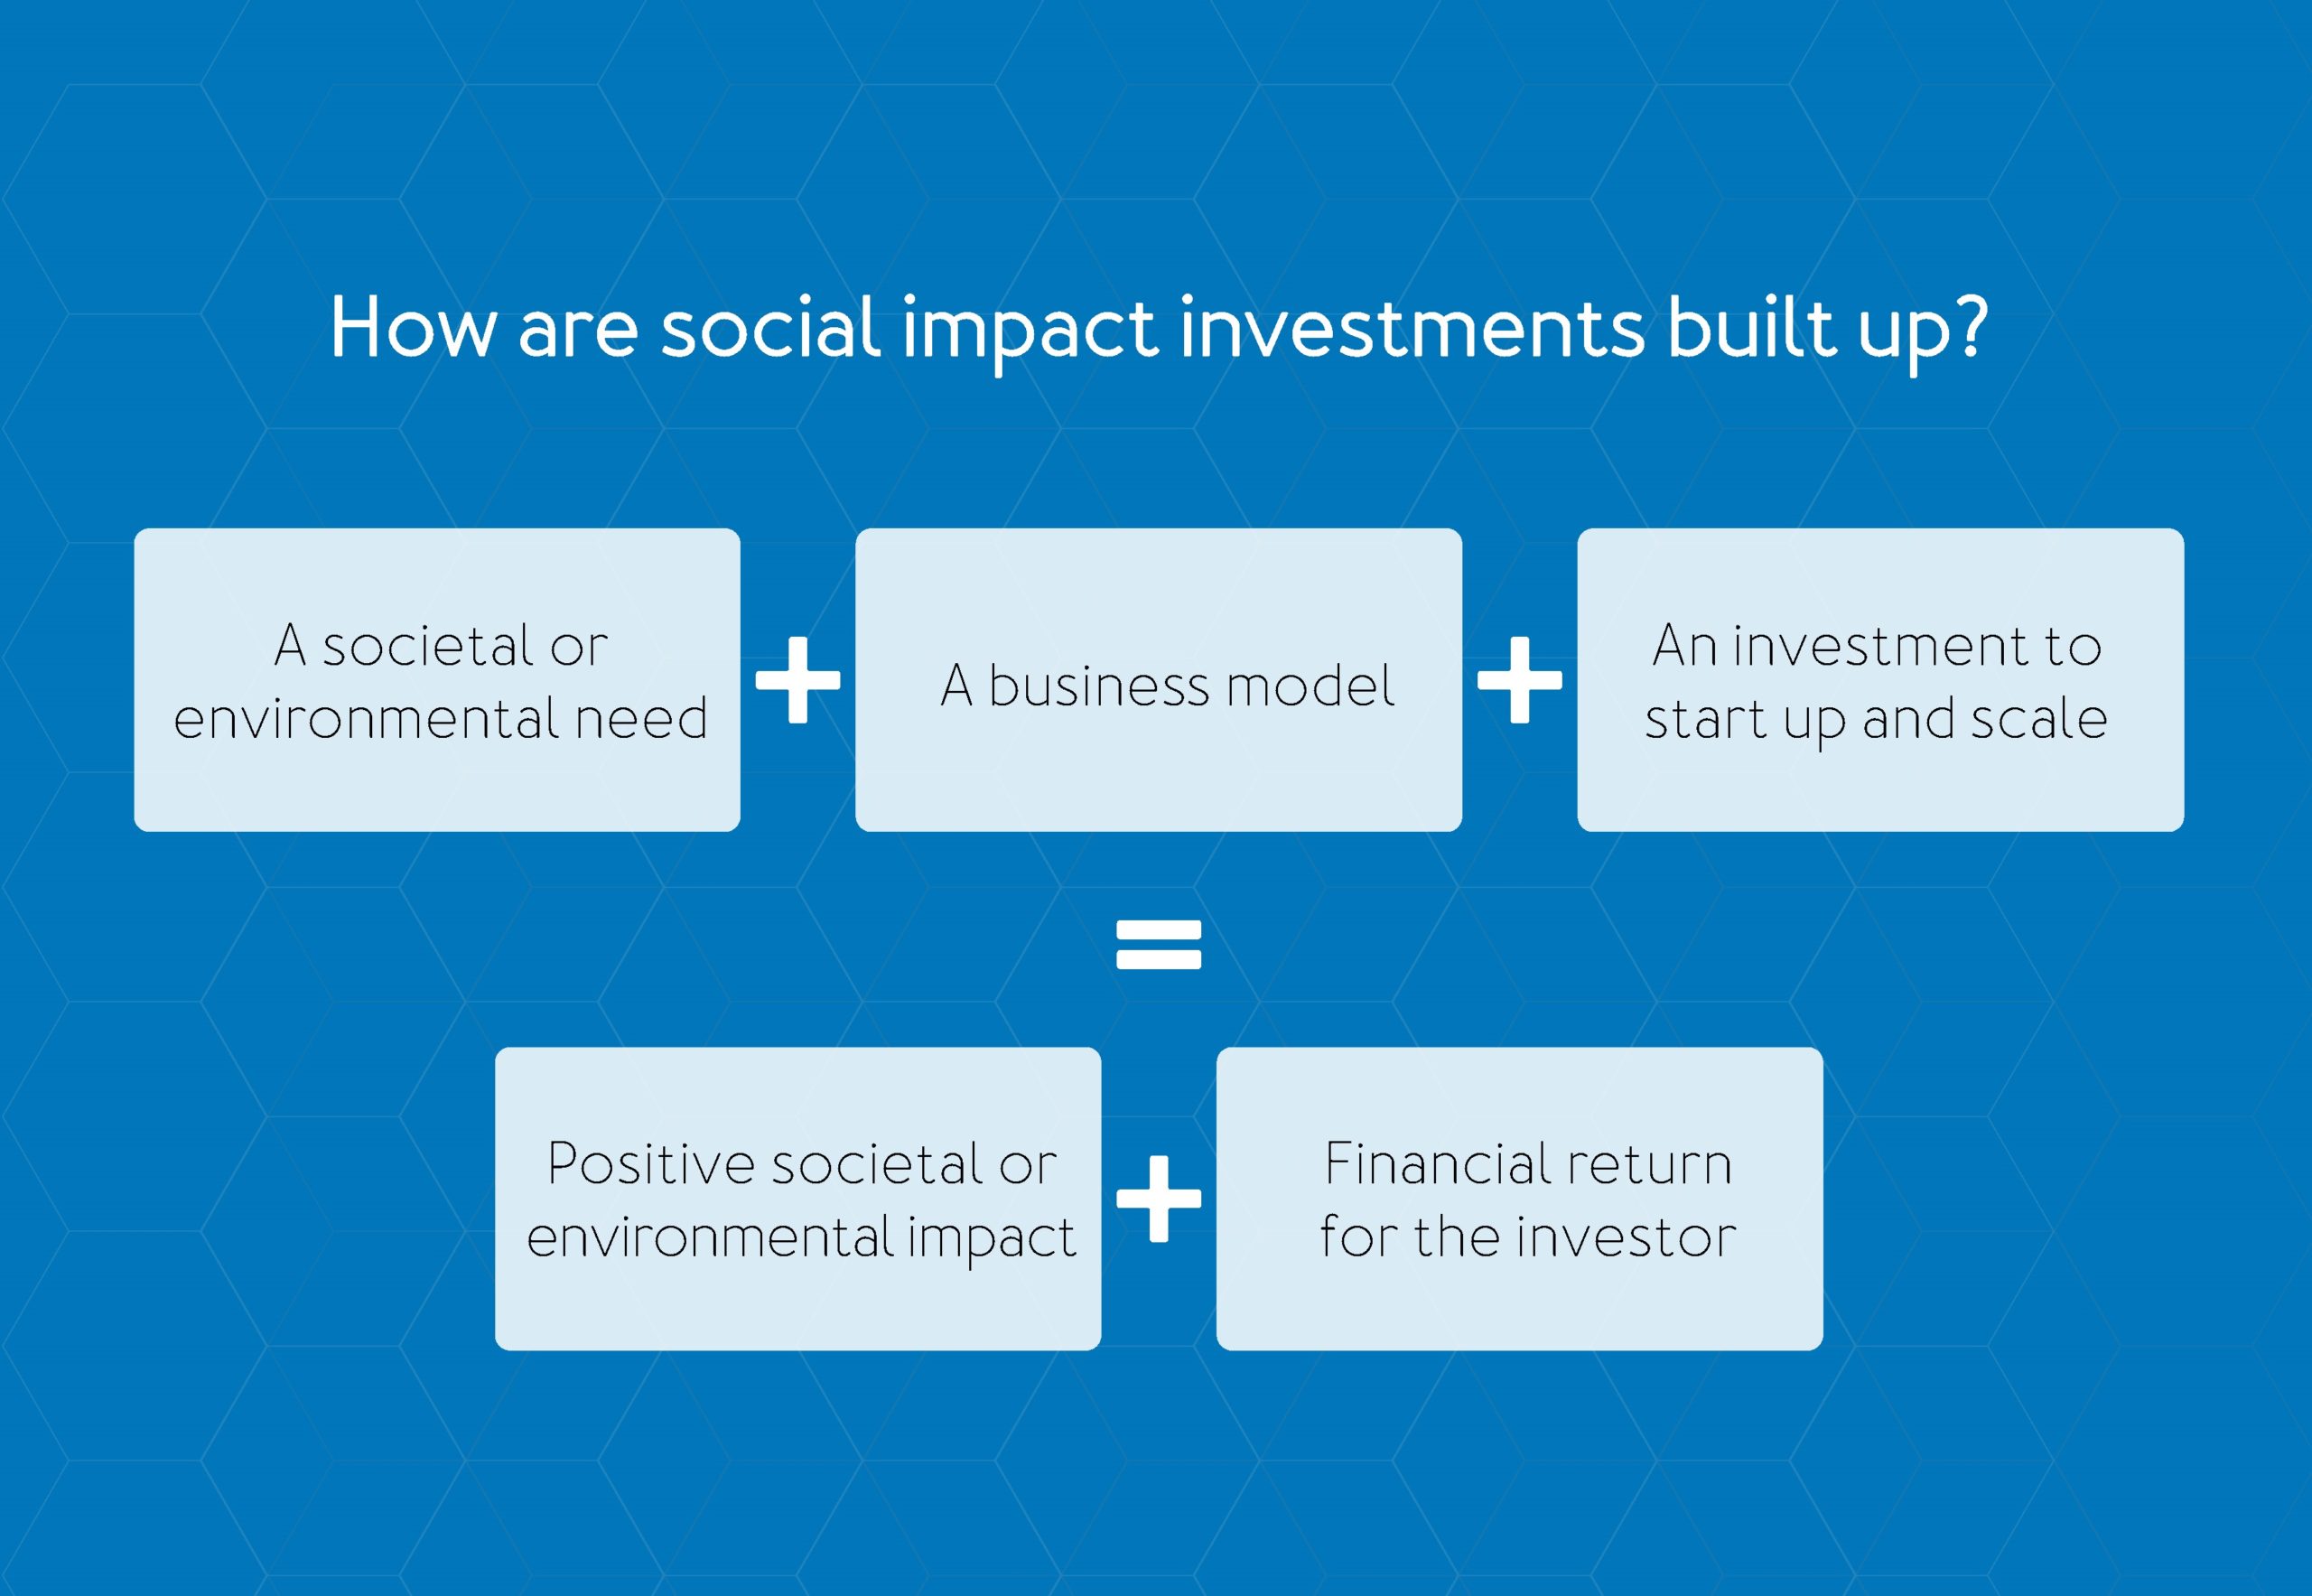
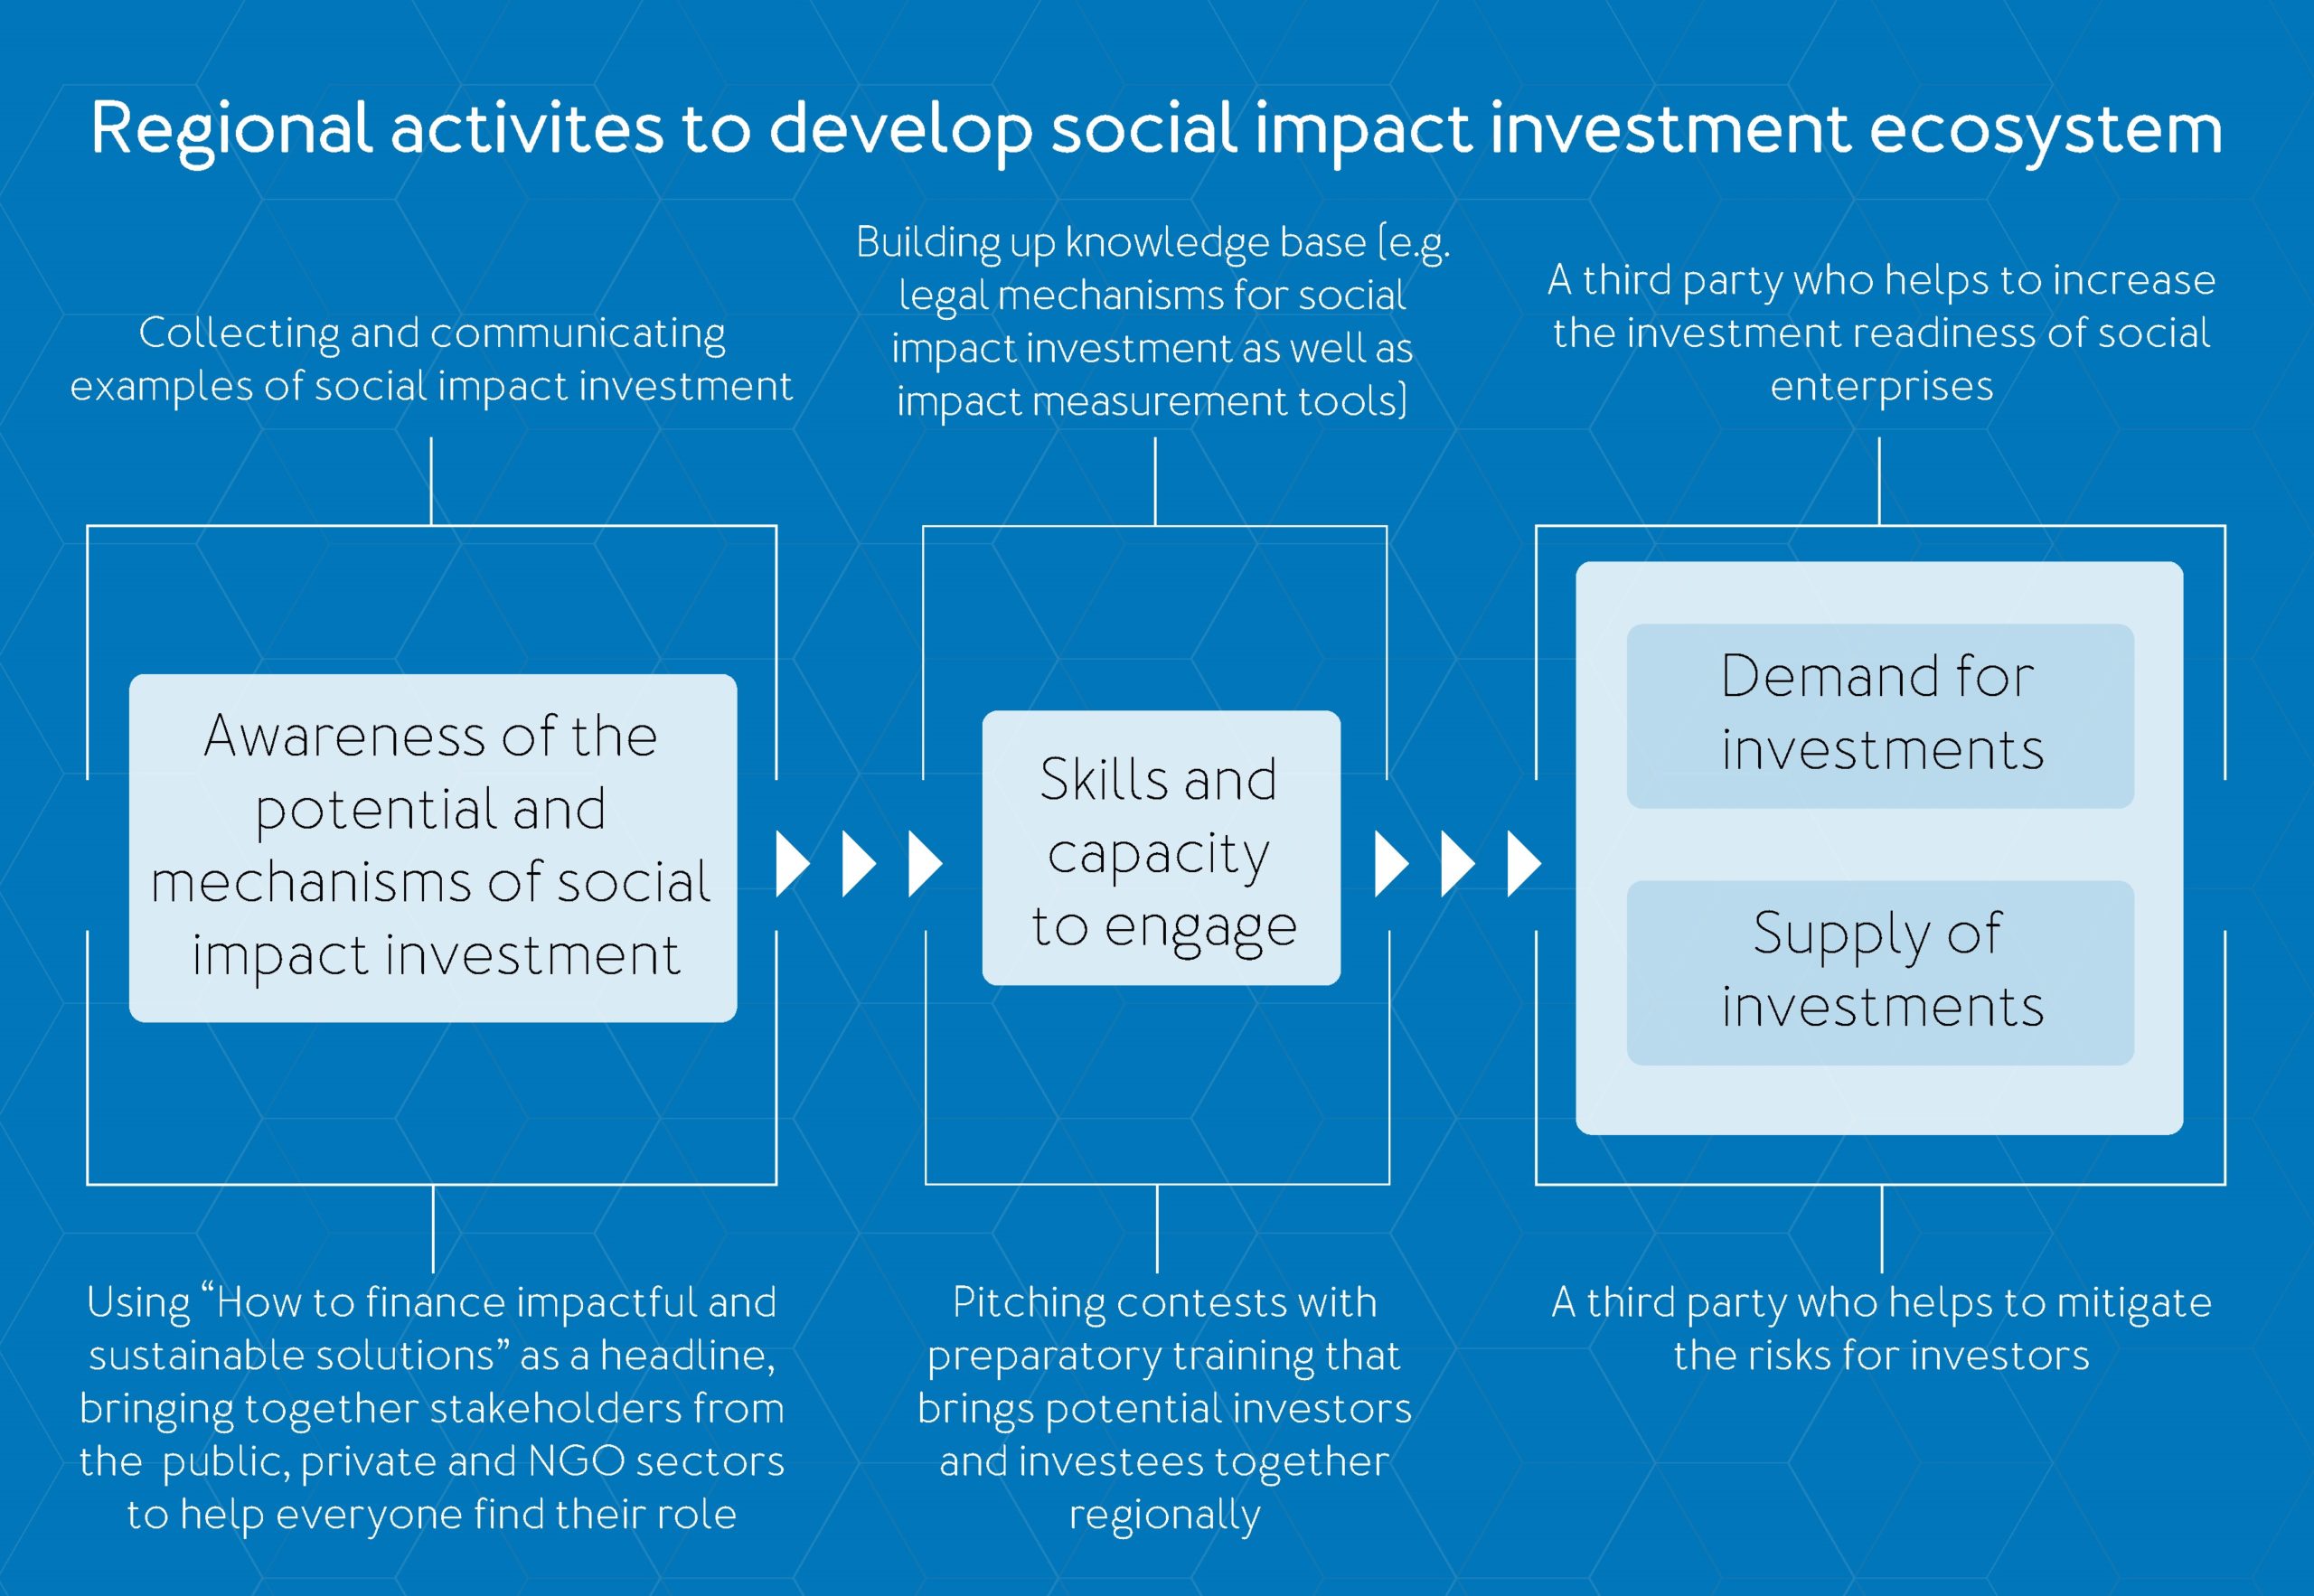
Example 1: defining a topic and then undertaking a step-by-step analysis.
Reference: discussion paper “Social Impact Investment in the Nordic-Baltic Region” (2018, in English).
Visualising the definition:
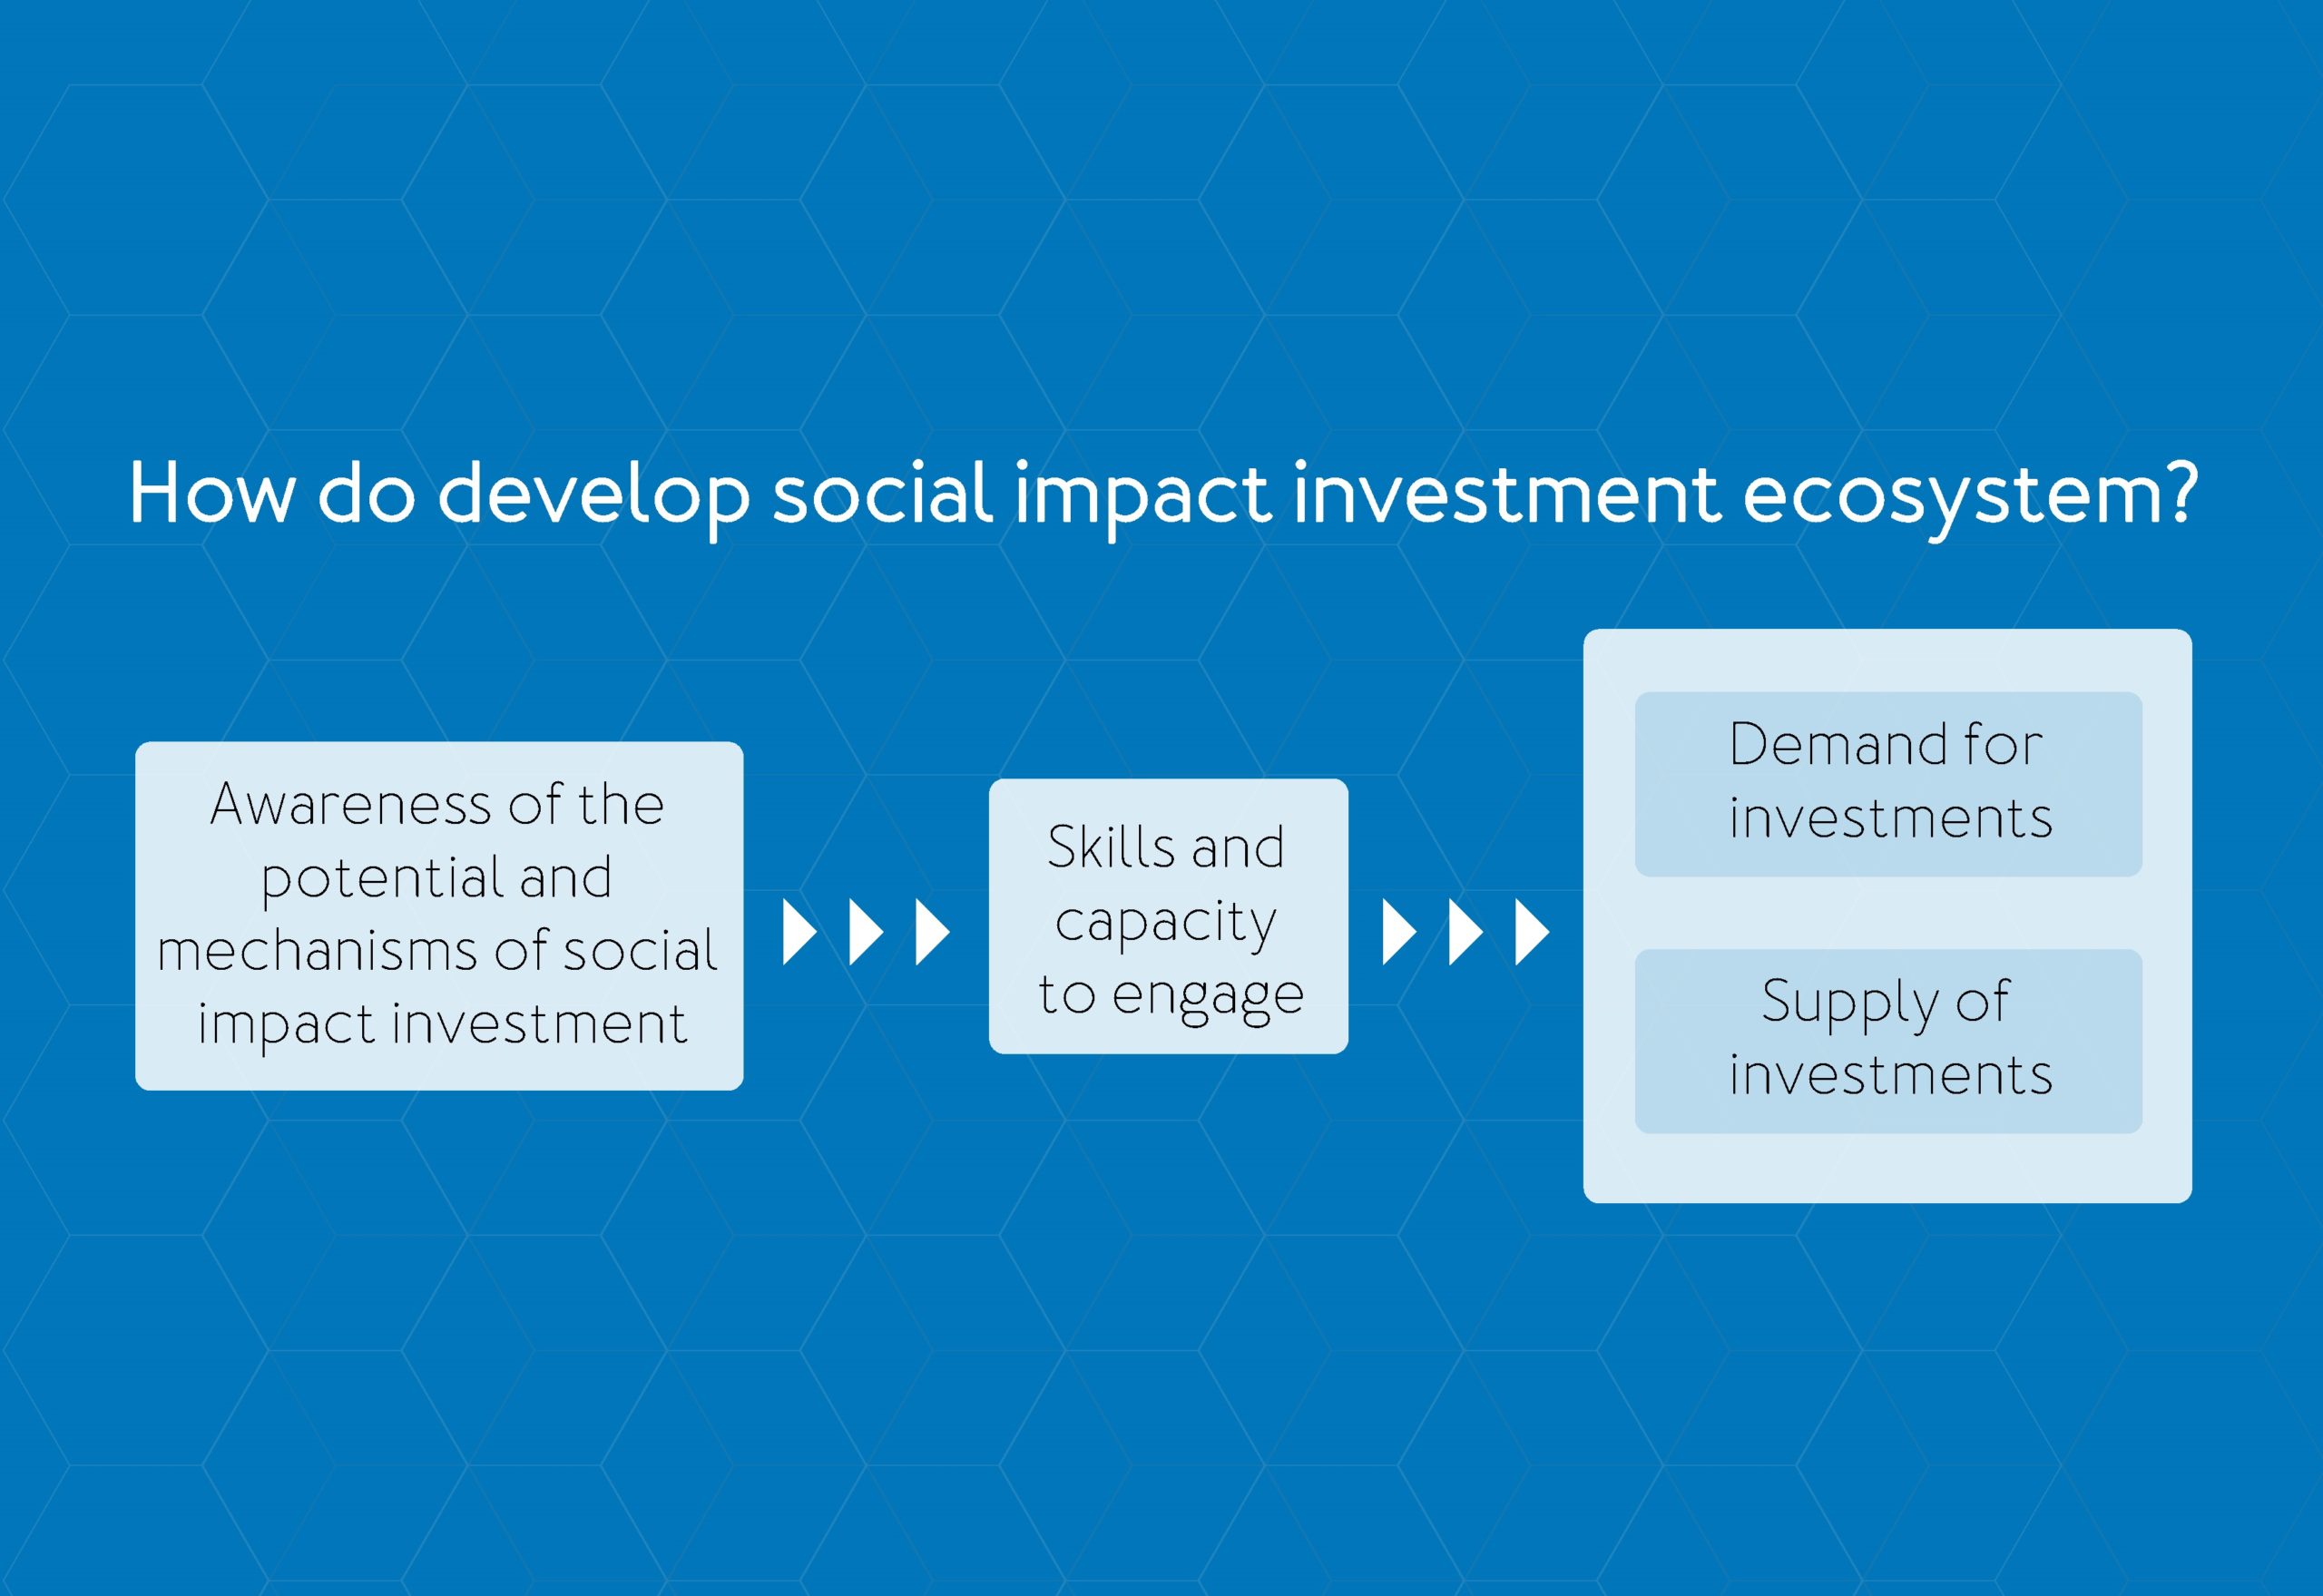
Mapping the key elements of the ecosystem:
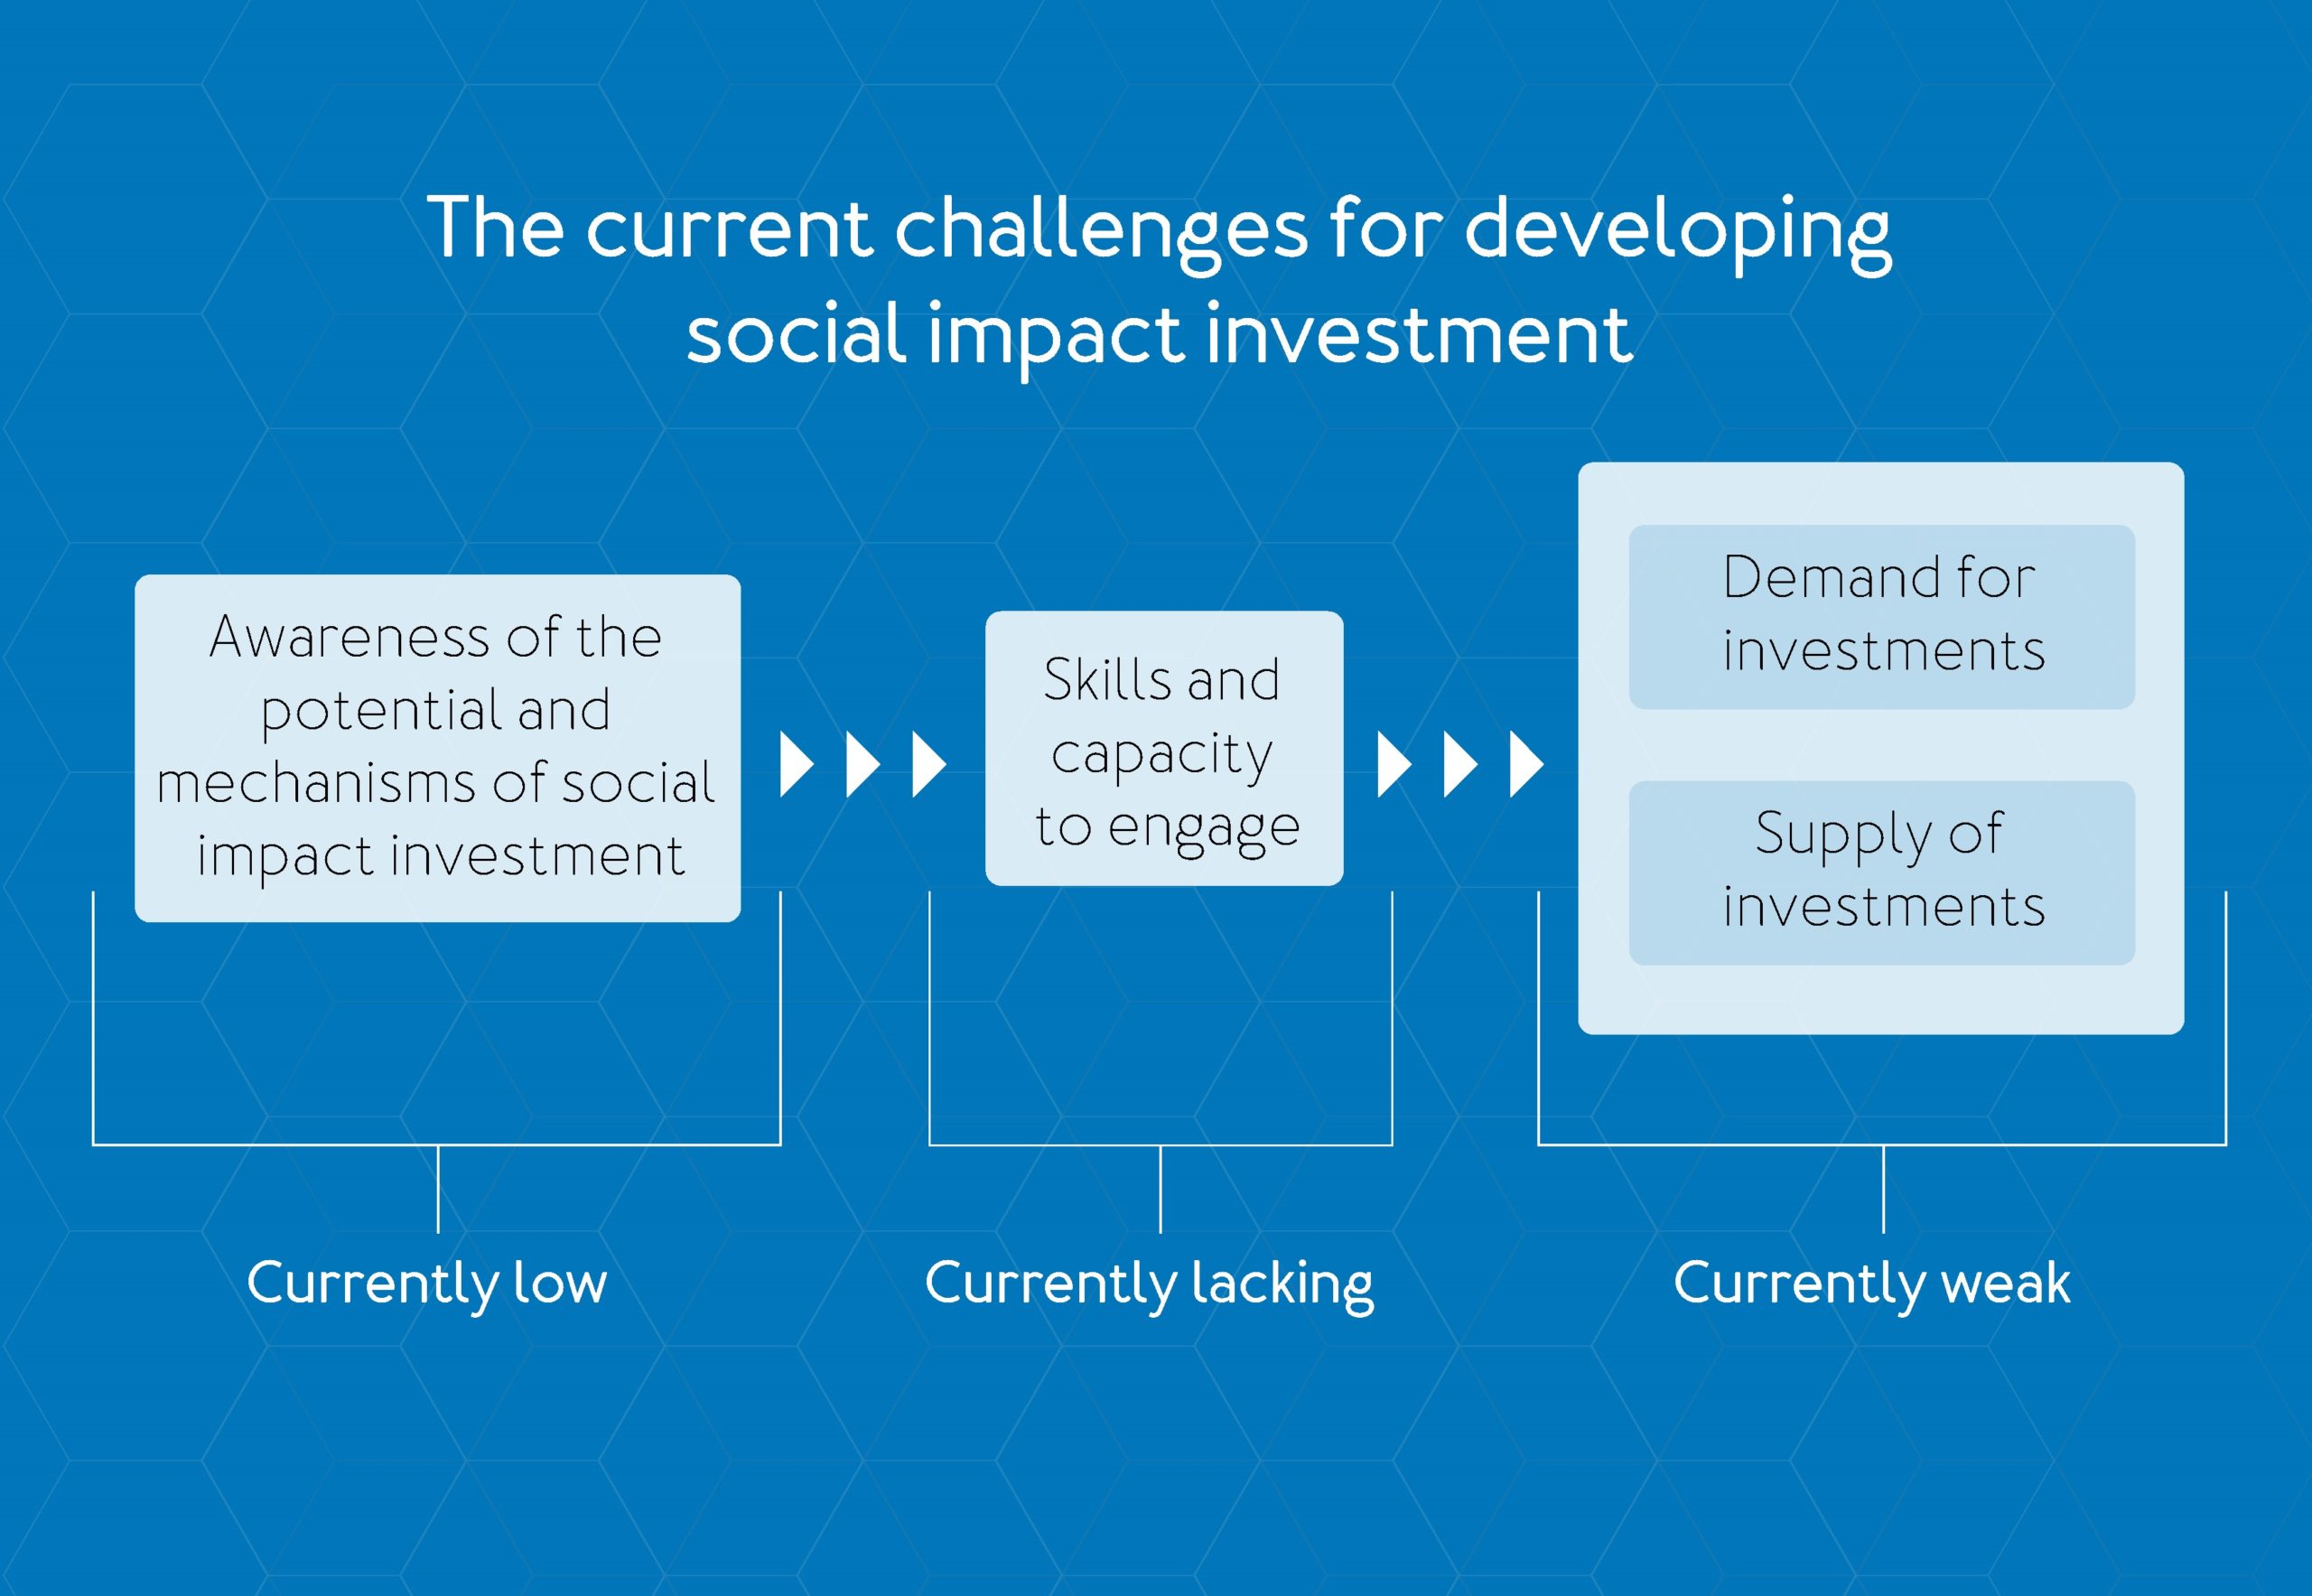
Indicating the main challenges related to the ecosystem development:
Mapping the solutions to support the development of the ecosystem:
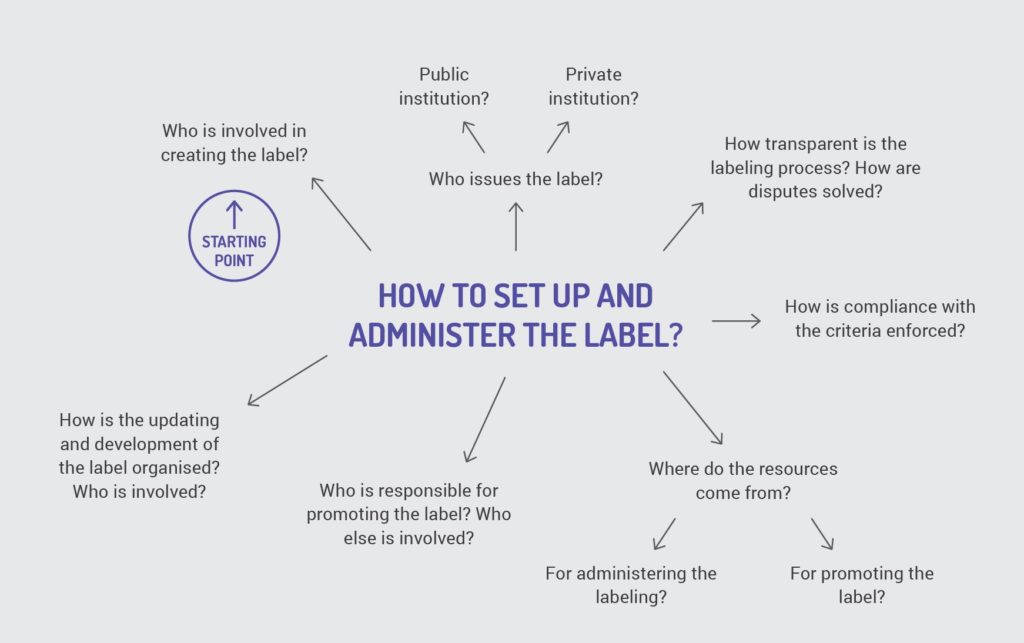
Example 2: forming a comprehensive step-by-step checklist of guiding questions or open issues related to a certain topic.
Reference: report “Social Entrepreneurship Certification and Labeling” (2017, in English).
The checklist below helps to remember the choices that need to be made in order to create and manage any labeling scheme (e.g. fair trade or ecolabels).
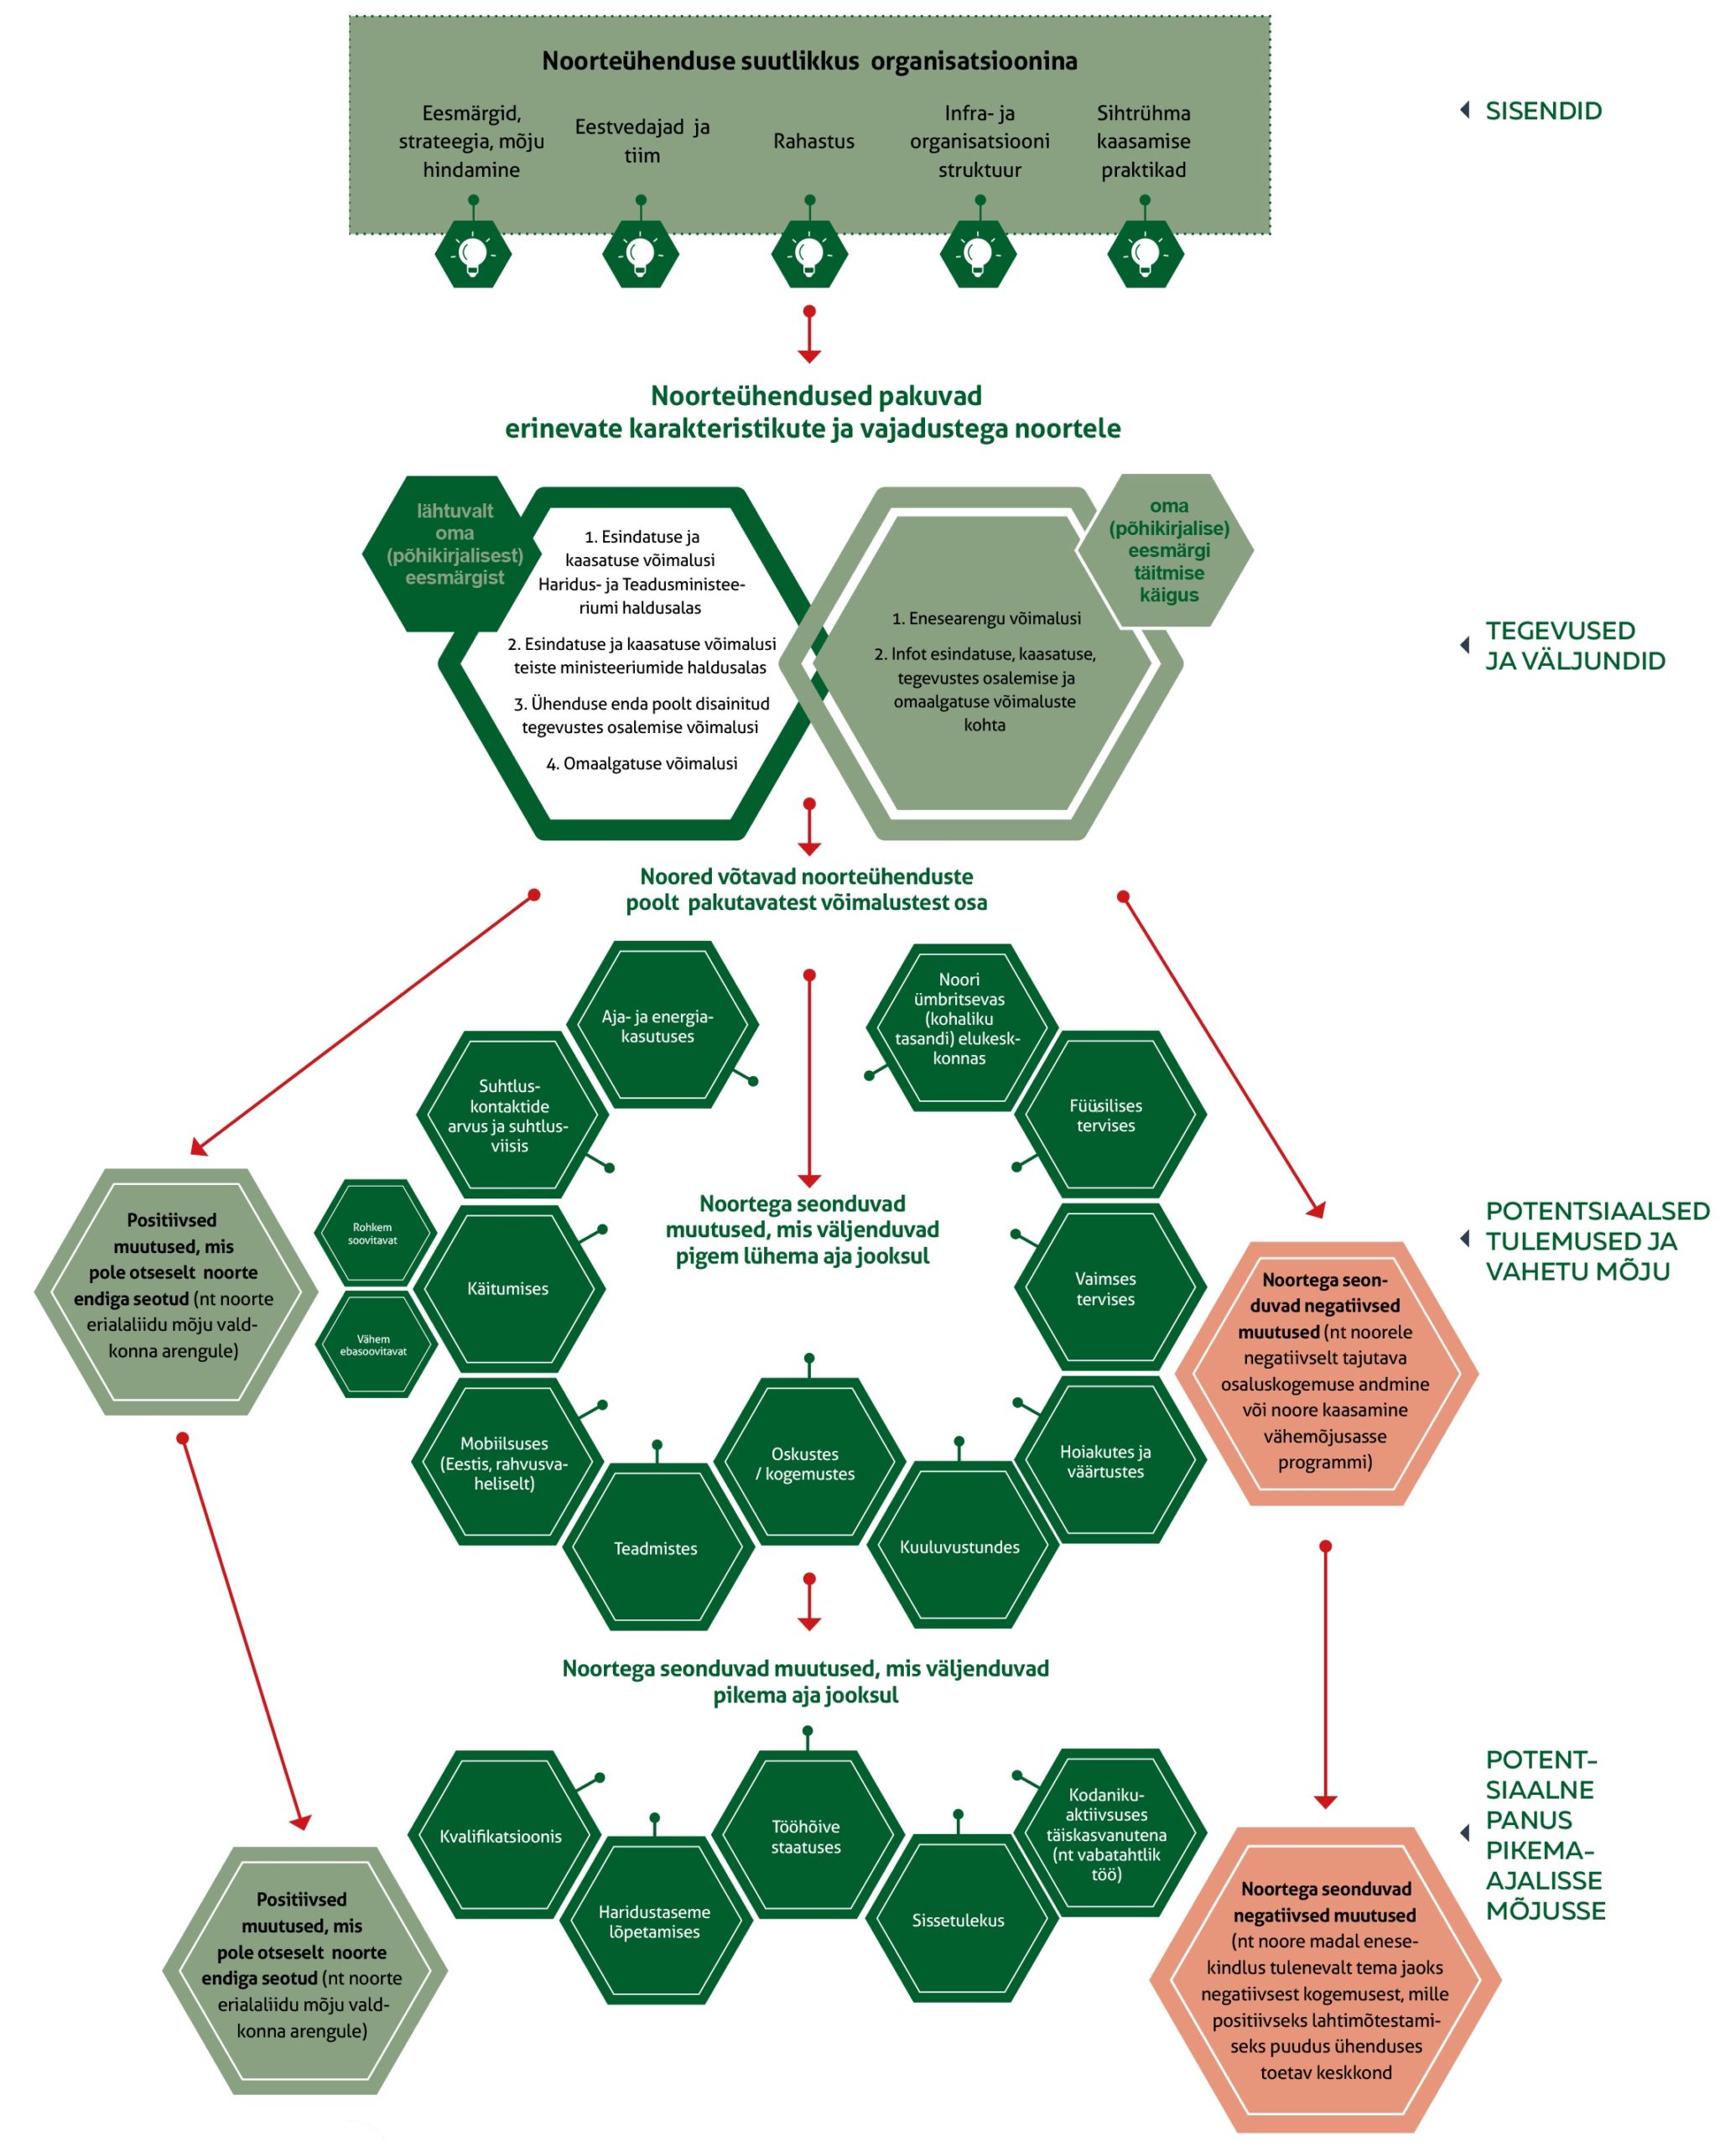
Example 3: structuring and presenting state-of-the-art knowledge related to a complex topic.
Reference: report “Impact Analysis of Youth Associations” (2018, in Estonian).
The illustration below exhibits a model that I built in order to show known elements of short-term and long-term impacts of youth associations. The content of the diagram is based on literature review as well as analyzing the work of youth associations by our research team.
Creation of nice-looking visuals is, however, only the final and perhaps the least important part of mind mapping.
The decisive factors in making diagrams useful for your work are collecting and structuring relevant information and using the drafts of the mind map to understand the issue better and plan real-life actions to create positive impact.
If you need any support in creating diagrams to support achieving your objectives, get in touch with us at info(at)storiesforimpact.com